Glassnode review: do on-chain metrics give retail more than free charts?
We browsed Glassnode's free-tier charts, priced its Advanced and Professional plans, and checked which on-chain metrics actually change a retail investor's decision before scoring the platform.
Our verdict
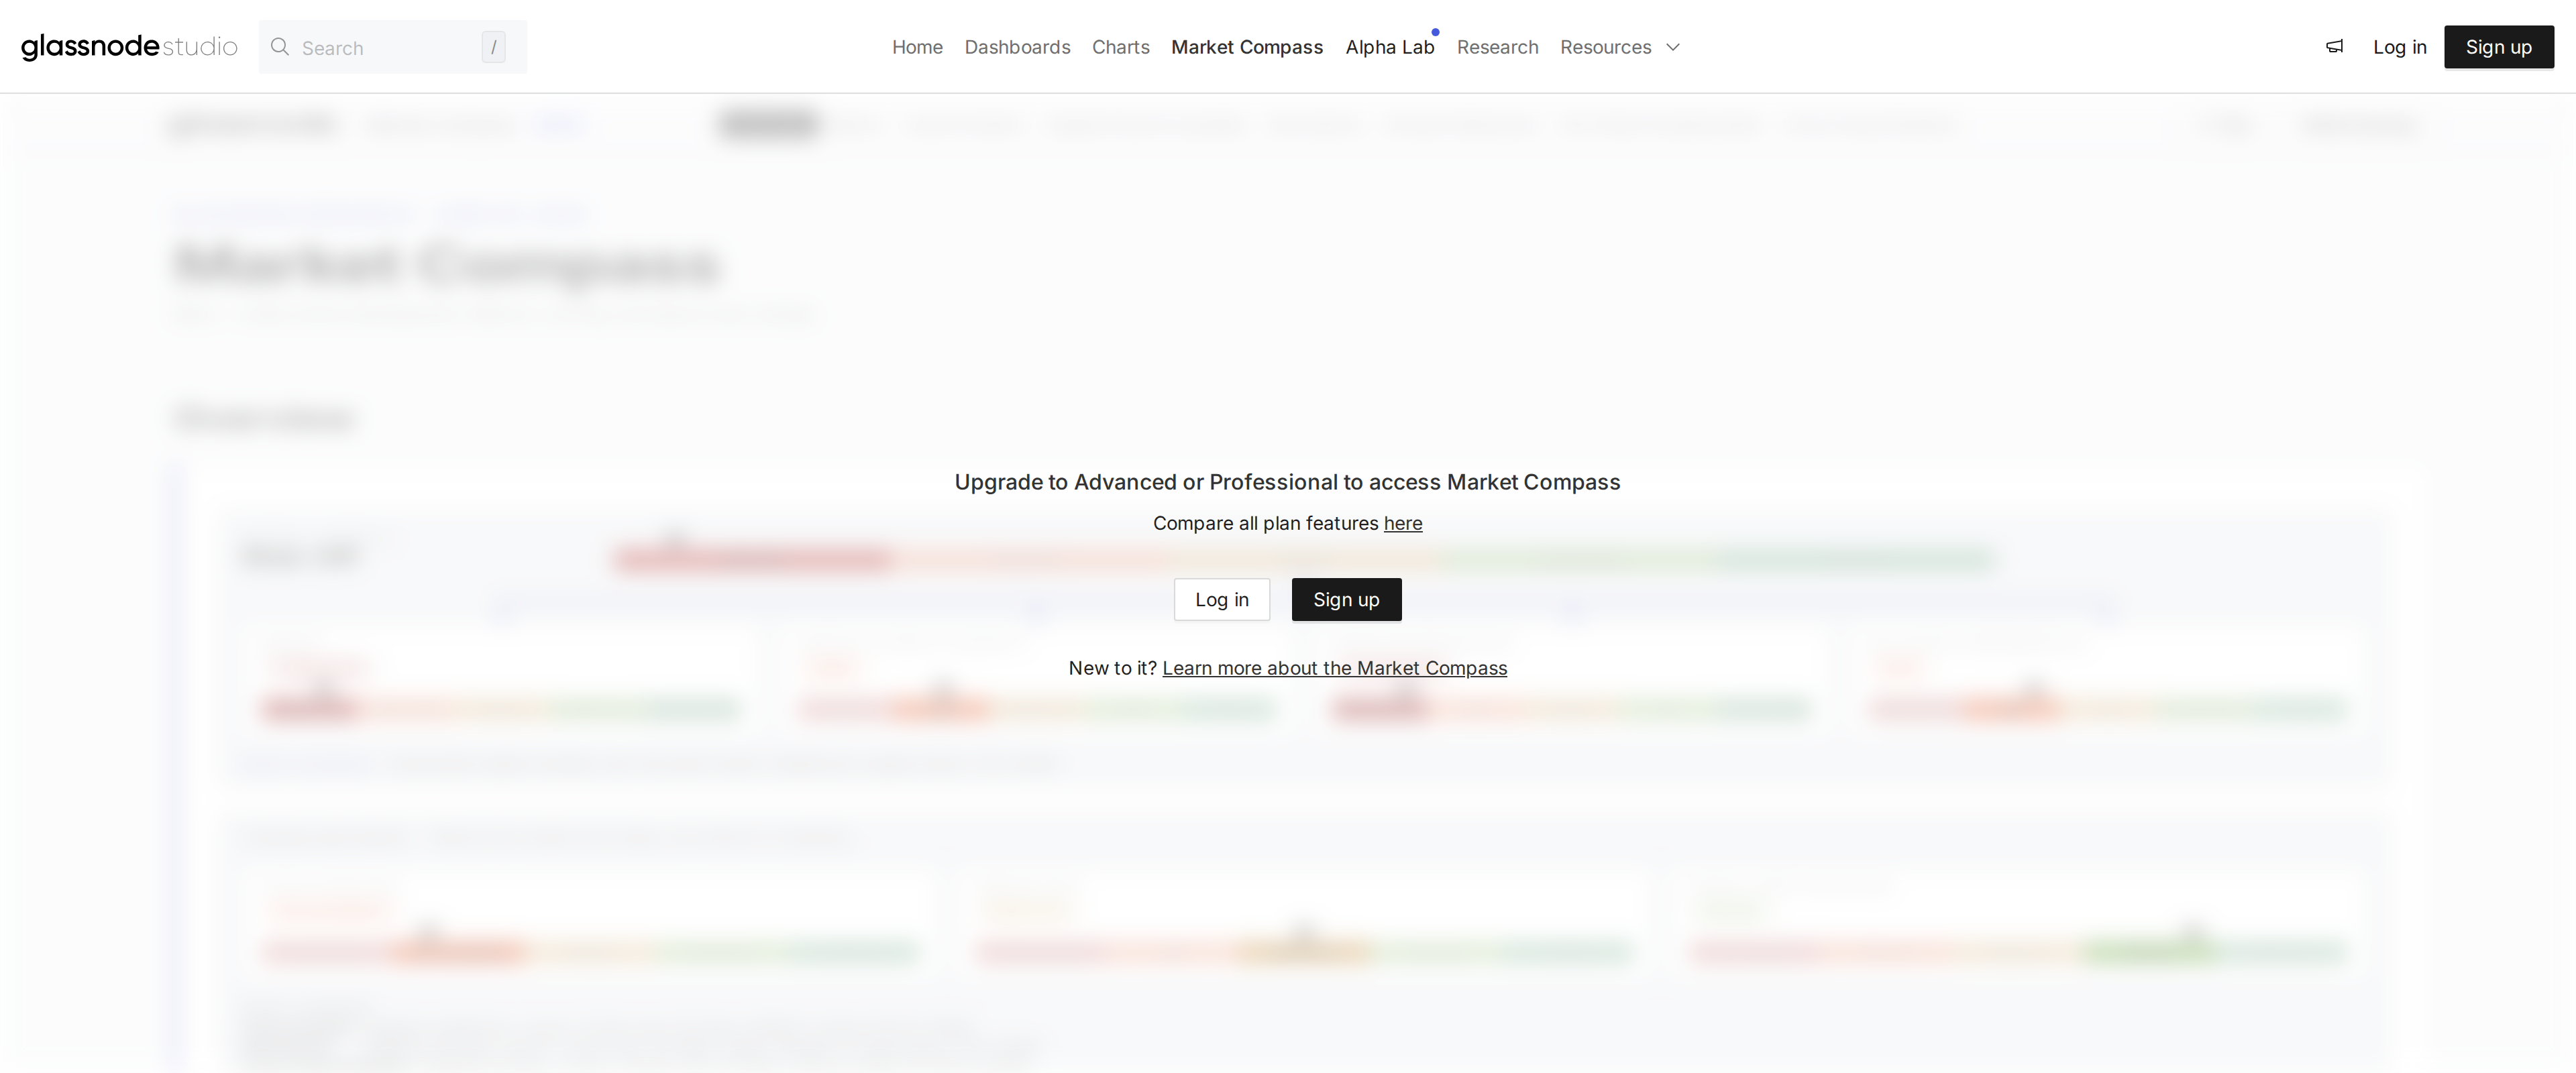
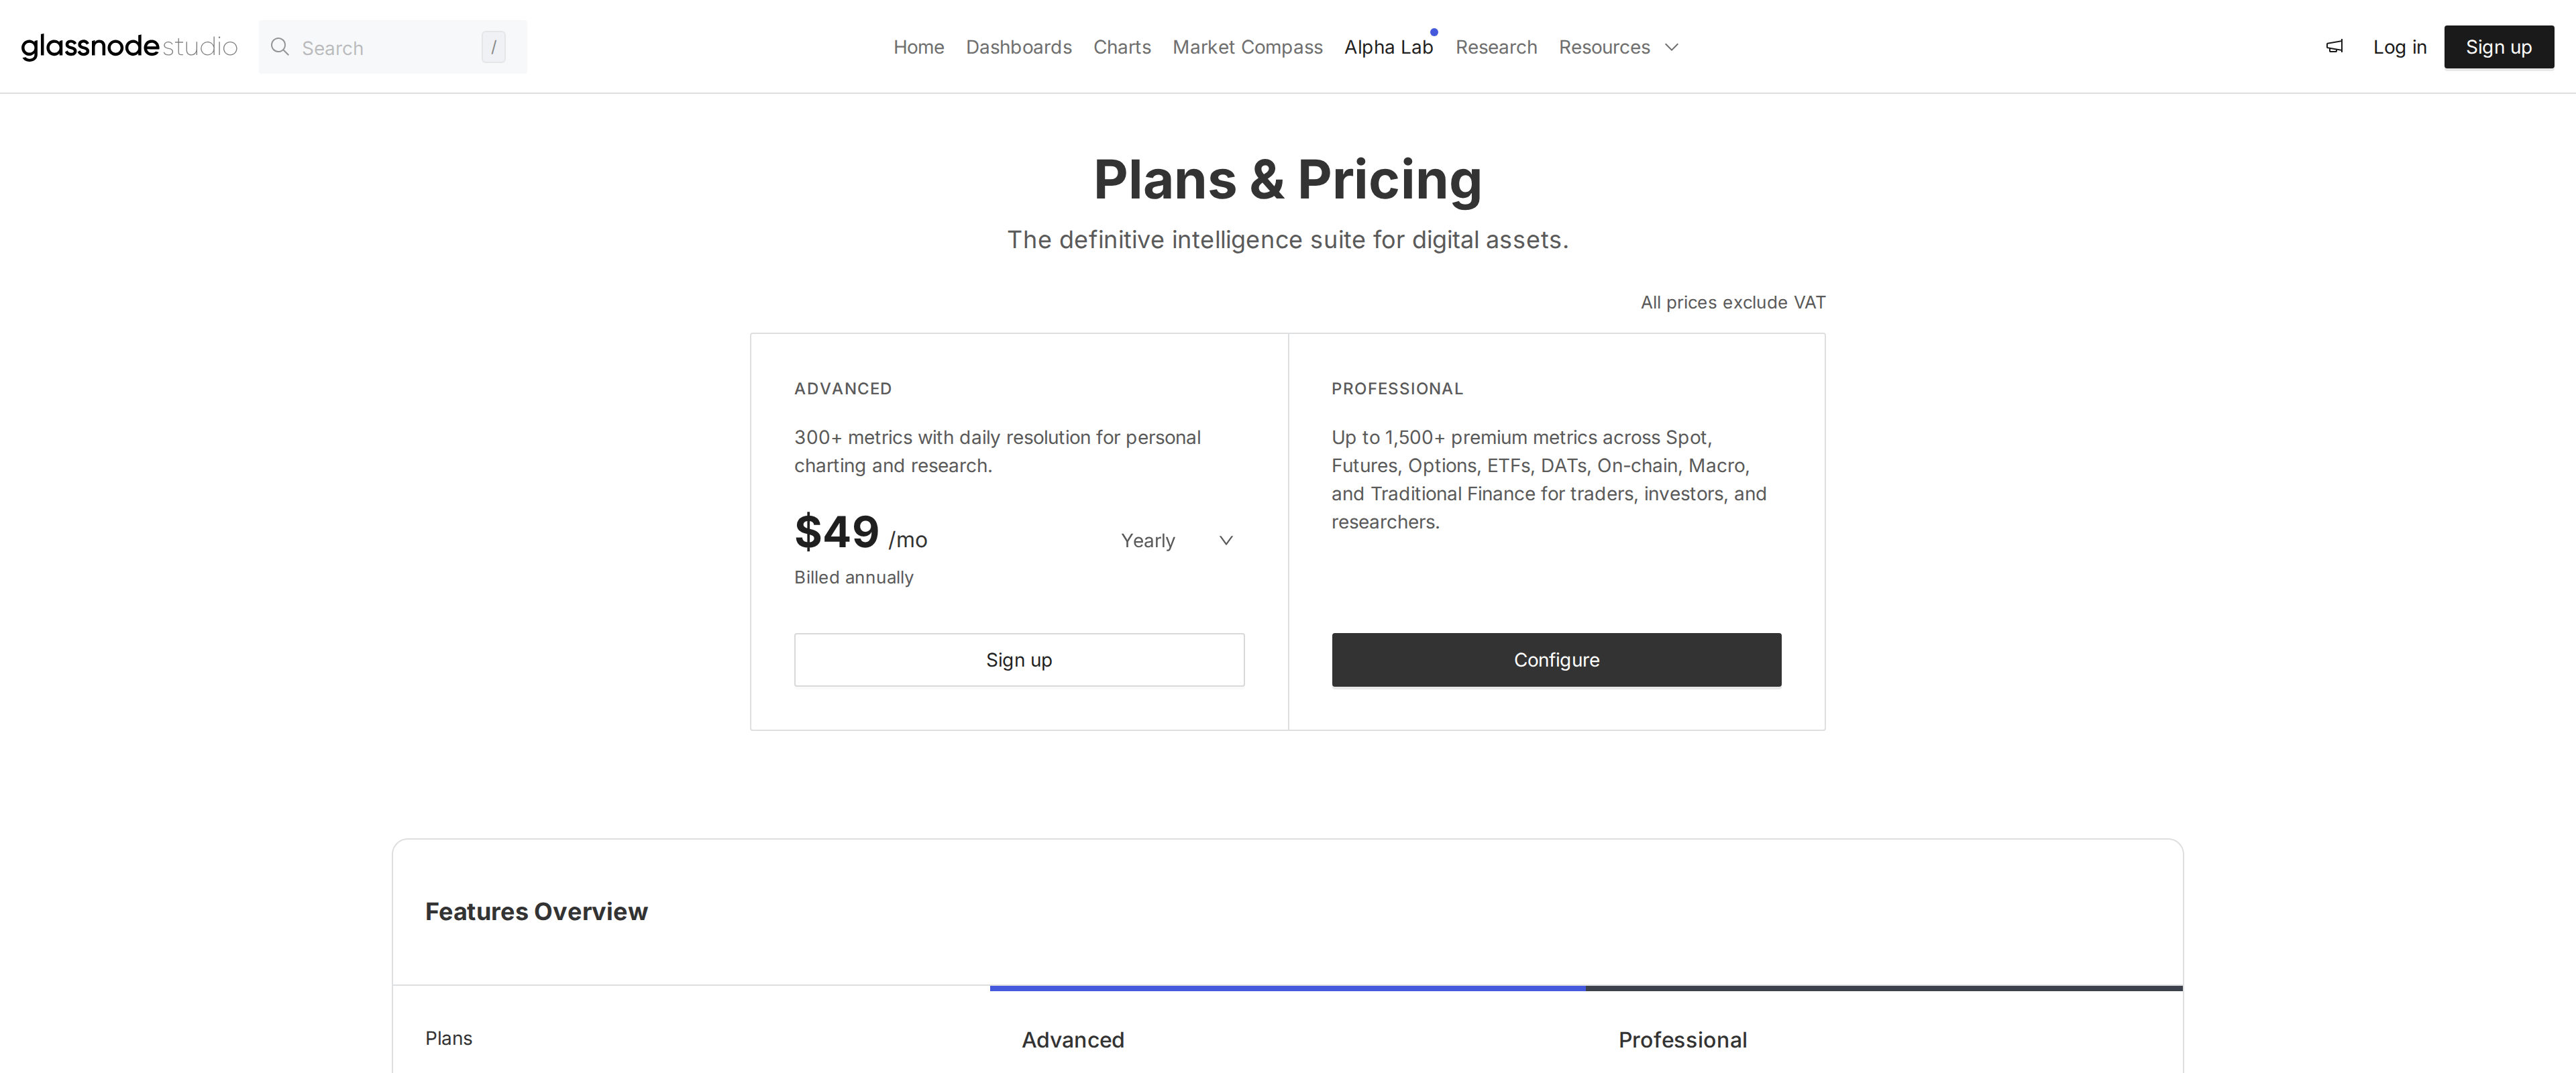
Glassnode's free Studio Standard tier gives a retail investor real signal already: realized price zones and long-term holder supply are both visible without paying, and they are the two metrics most likely to change what a long-term holder actually does. The paid tiers exist for a different buyer. Advanced at 49 dollars a month unlocks hourly resolution and derivatives data that a swing trader can use, but Professional at 999 dollars a month, with 1,500-plus metrics and 1-minute resolution, is built for a desk, not an individual holding a portfolio on the side.
Best for: Long-term holders who want realized-price and holder-cohort context beyond price charts
Glassnode's pitch is that a price chart tells you what happened and on-chain data tells you why. We spent time on the free tier, priced out the two paid plans, and tried to answer a narrower question than the marketing asks: does any of this change what a retail investor actually does with their holdings.
What the free tier already gives you
Studio Standard costs nothing and still ships with genuinely useful signal: T1 metrics at 24-hour resolution and one alert. Realized cap and cost basis metrics fall inside that free tier, and they matter because they show where the market's actual buy-in price sits, not just where the current price is relative to a chart pattern.
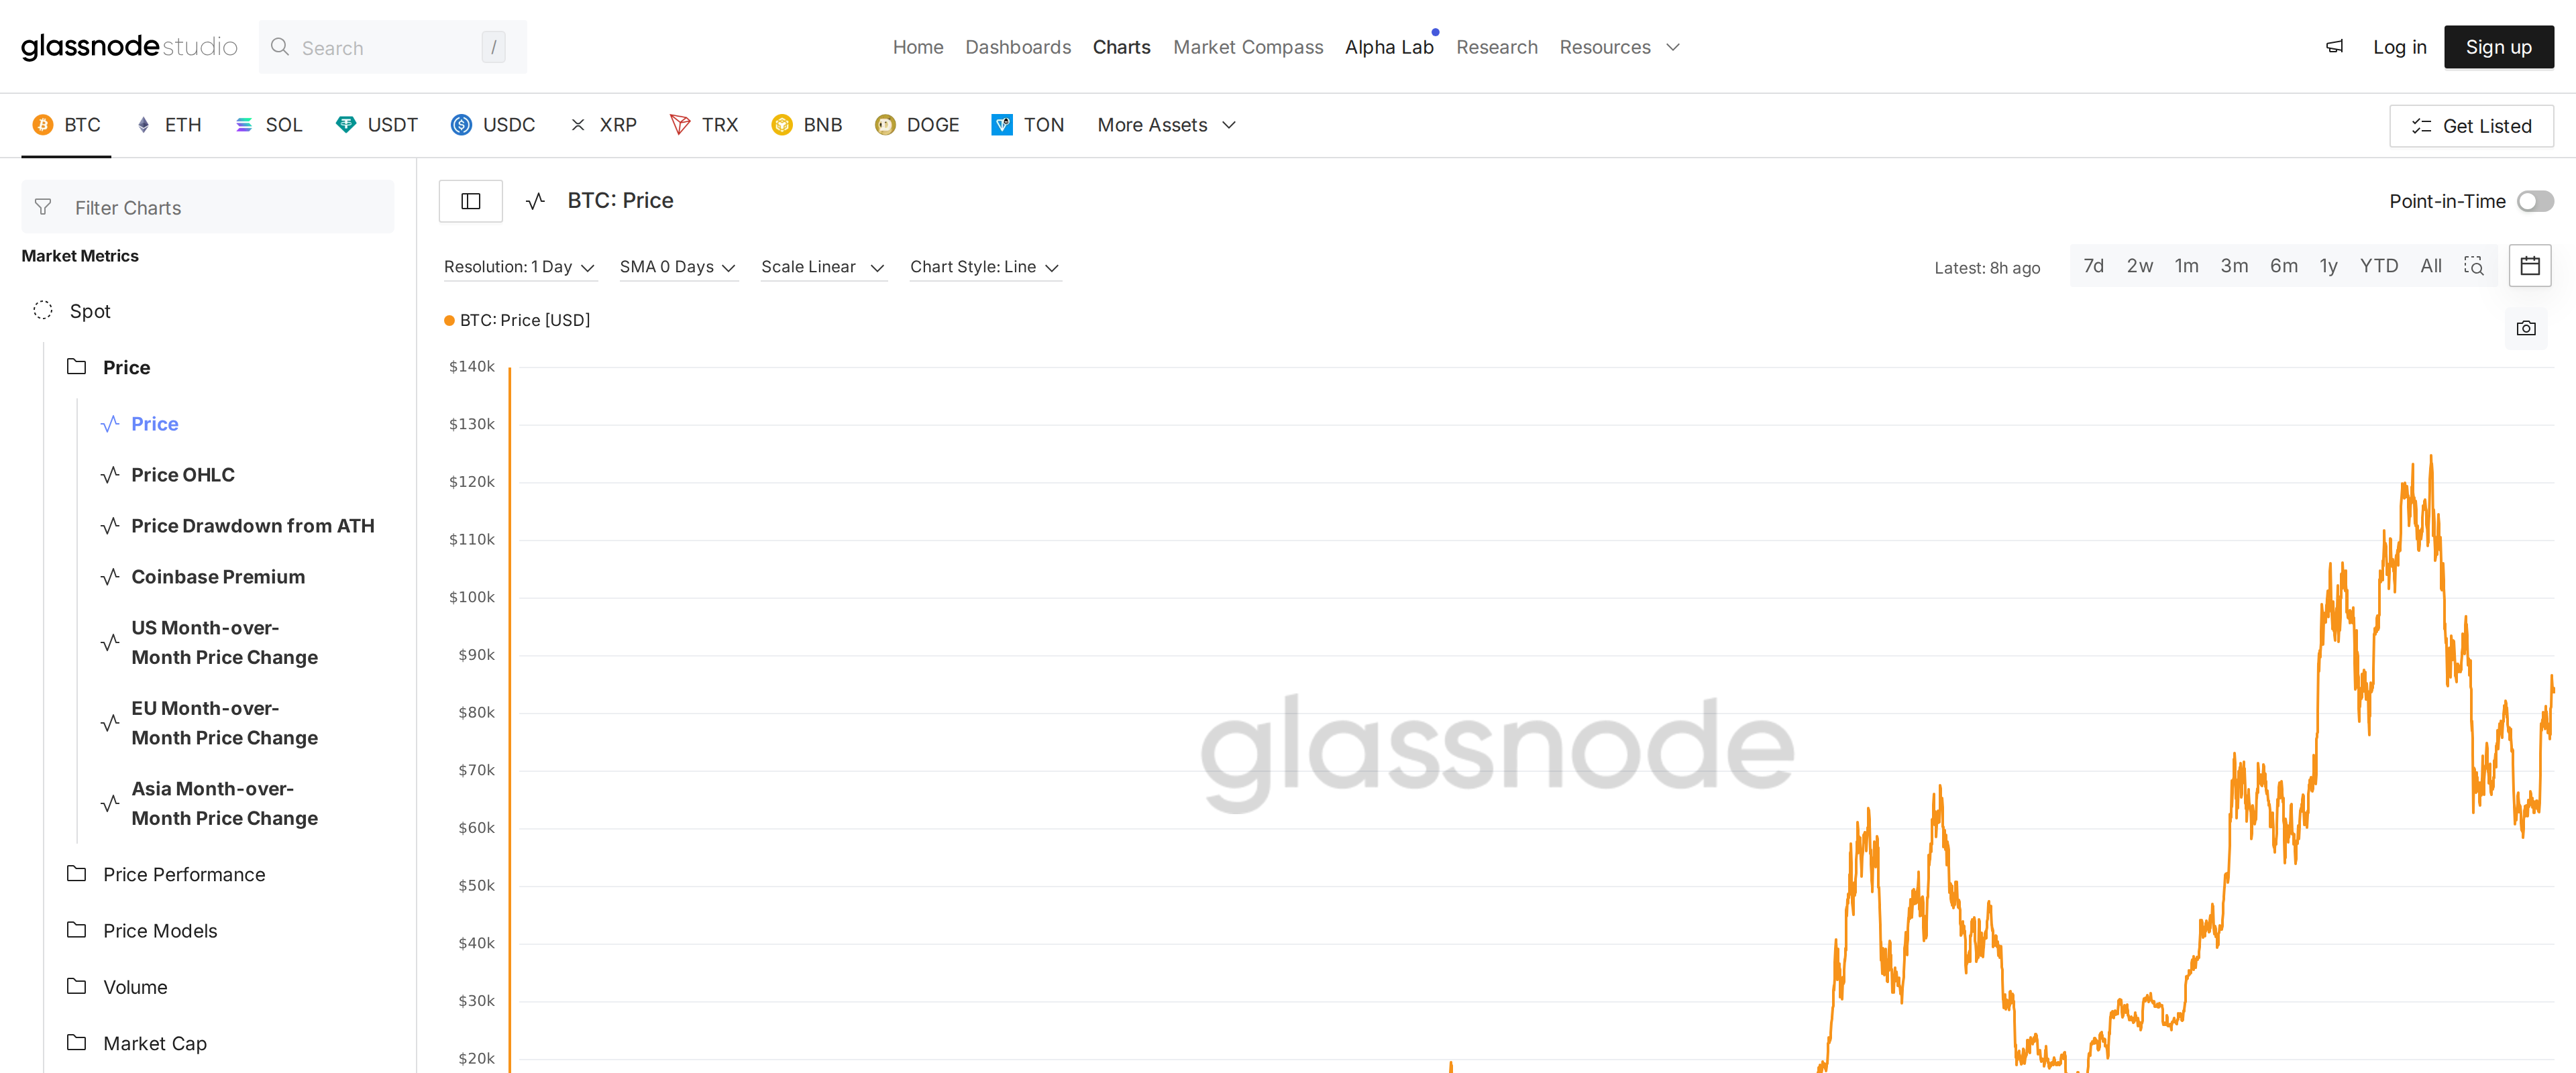
Long-term holder supply is the other metric worth knowing exists before paying anything: it separates coins that have not moved in months from coins actively changing hands, and that distinction says more about conviction in the market than volume alone. A retail investor who only ever looks at candlesticks is missing a genuinely different lens here, for free.